.
.
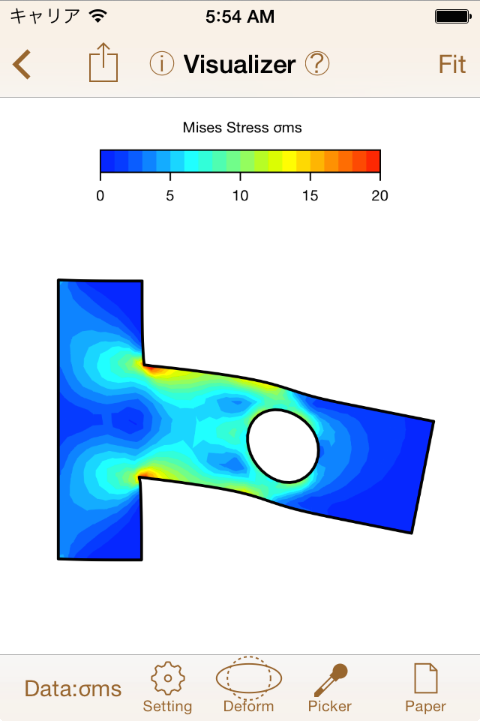
As shown in Fig.7.1, Visualizer displays a color contour and a deformation state of FEM result.
The visualized physical quantity can be selected by tapping Data: .
The settings of color, color bar, and etc., can be changed by .
On/Off of the deformation and magnification can be set with  .
.
The value at specified point can be evaluated with  .
.